
KPI Dashboards Your Whole Team Can Trust
Insight BI KPI dashboards bring the data from every system into one place, set up the way that matters most to you. No calculations and no chasing figures, just the numbers you need to make quick decisions without the risk.
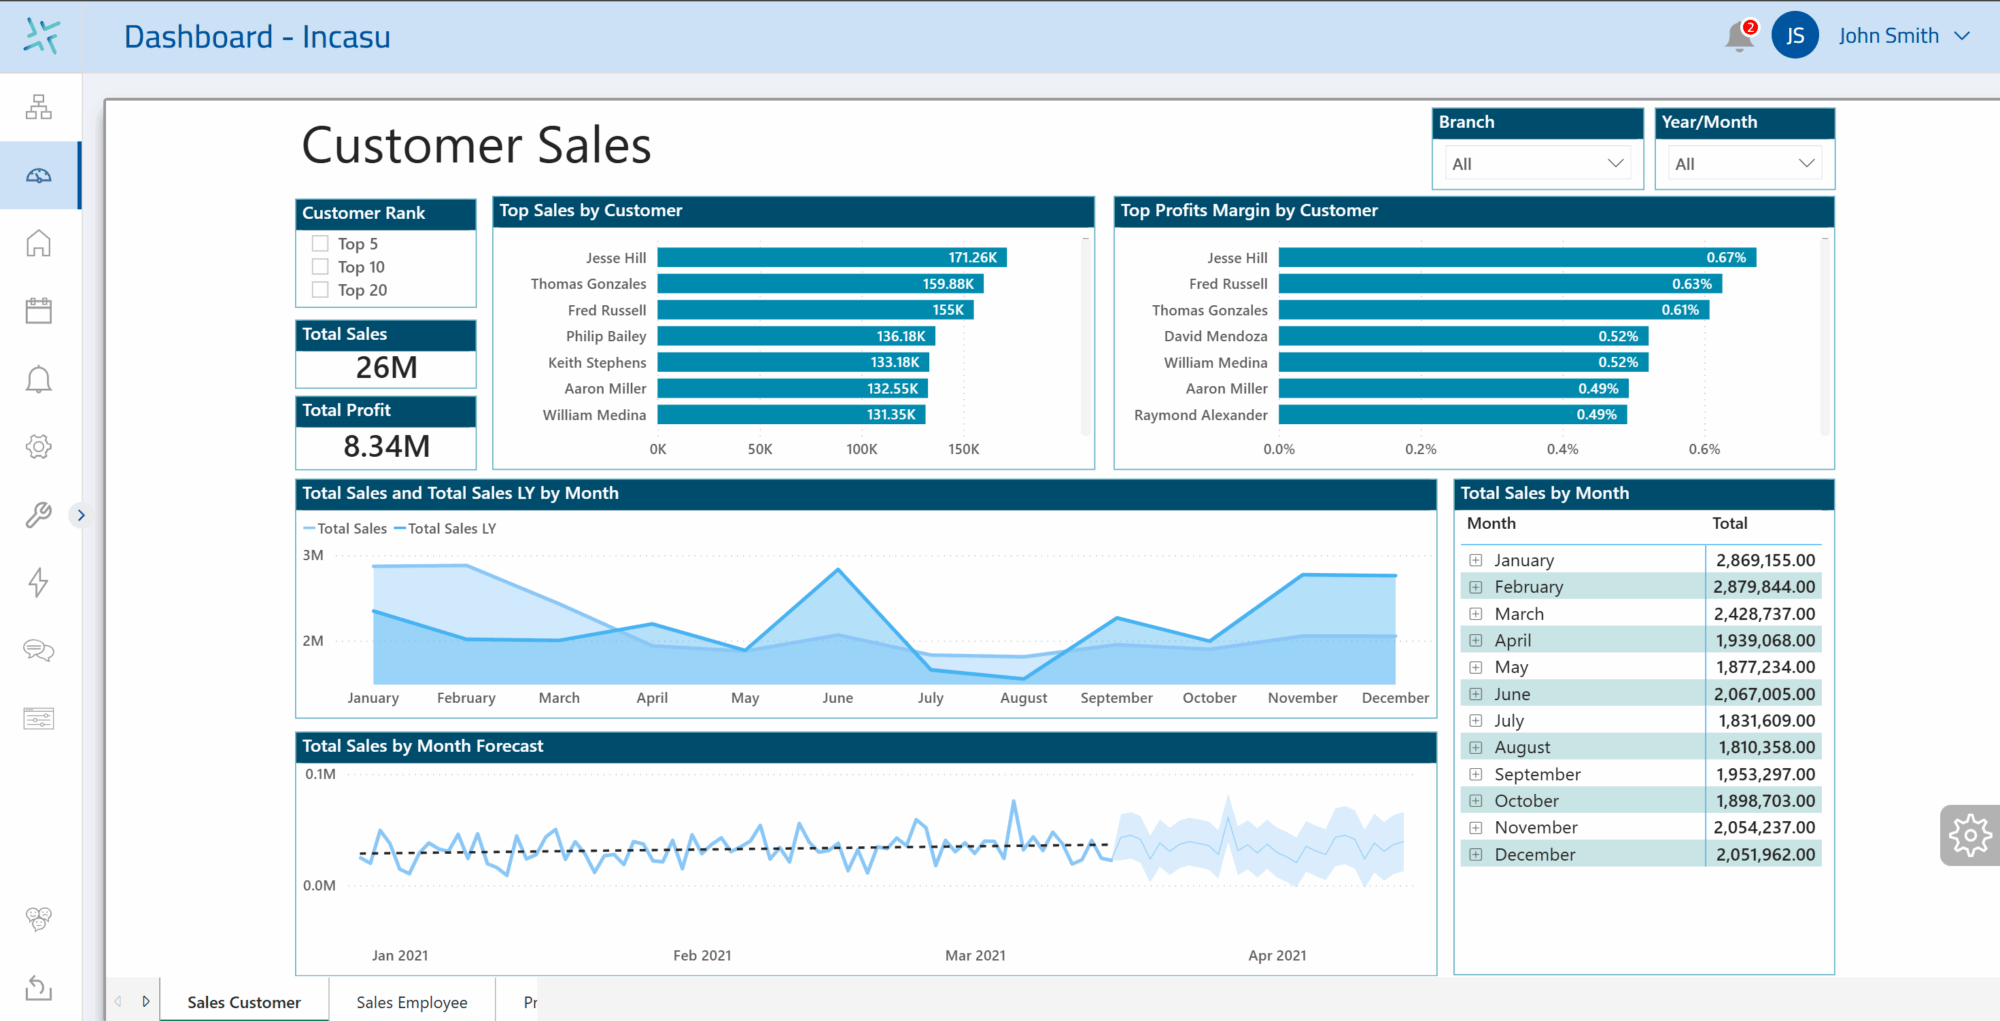
All the data, analysed and displayed visually, for total peace of mind.
Every Source, One Place
Insight BI brings together data from multiple sources and databases, so you’re never chasing figures across systems again.
Always Up To Date
Insight BI continuously syncs with your connected databases and spreadsheets, so every metric is current, no manual refreshes needed.
Clear, Interactive Visuals
Charts, graphs and summary tiles highlight what matters, so you can spot patterns, track progress and compare results at a glance.
All this is made possible by our ETL Process.
Every dashboard is powered by how we extract, transform and load your data behind the scenes, so what you see is always accurate and ready to act on.
Explore the ETL Process >>
Additional areas that Insight BI will help your organisation.
Customised & Automated Reporting
Readily available reports, customised to your needs. Download the latest information or have it waiting in your inbox.
Read more >>Triggers & Threshold Notifications
Be notified when specific targets are reached, or limits breached. Be proactive in your industry—stay on top of your business’s data.
Read more >>Add / Edit Data Directly on Your Database Effortlessly
Add and amend information with ease. With secured access control and safety checks, business has never been made this easy.
Read more >>Turn Your Business Data Into Your Greatest Advantage.
Discover how Insight BI brings all your business data together into clear, interactive dashboards that help you monitor performance, identify opportunities, and make confident decisions faster.
Book Your Free Consultation